Your email campaigns are so much more than just messages – they generate massive amounts of data about your audience. Opens, clicks, unsubscribes, and more, these are all data points that can become powerful tools to improve your campaigns. But how do you turn all this information into action? In this guide, we’ll focus on email data analysis and show you how to use it to achieve even better results.
Why is it Important to Analyze Email Marketing Data?
The data we collect from the emails we send provides accurate insights into how your audience interacts with your messages. It helps you understand what’s working, what’s not, and where there’s room for improvement.
Key Benefits:
- Effective Measurement – Understand which emails are achieving results and which aren’t.
- Continuous Improvement – Fine-tune your messages and maximize their potential.
- Target the Right Audience – Spot trends and refine audience segmentation.
So, How Do You Work with Email Data?
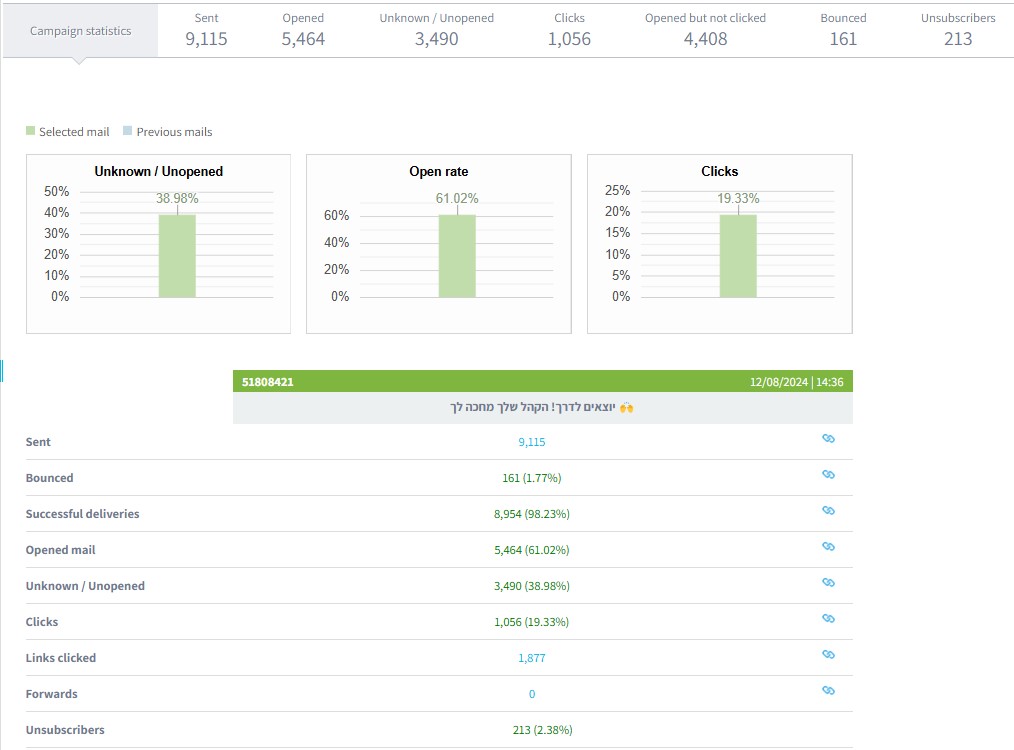
- Identify the Key Metrics The system lets you track a variety of important metrics, including:
- Open Rates – How many people opened your email? This reflects initial interest.
- Click-Through Rates – How many people clicked on a link in the email? A key measure of driving action.
- Unsubscribes – How many people unsubscribed? This indicates the relevance of your content.
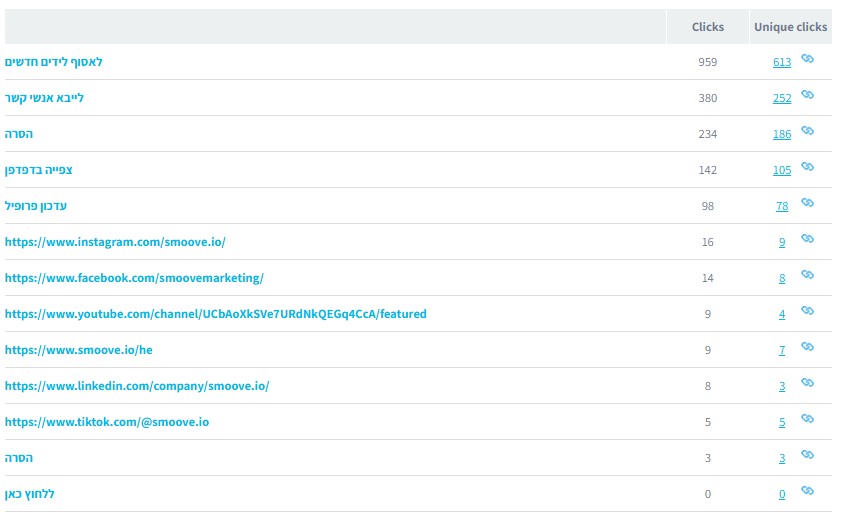
- Click Breakdown – Which links in the email received the most attention and clicks?

- Analyze the Data Once you’ve collected the data, it’s time to analyze it. Ask yourself:
- Which email subjects had the highest open rates?
- Are there links that the audience clicks on more often?
- When is the best time to send emails? (days/times)
- Spot Patterns and Insights By digging into the data, you can uncover trends that will help you improve future emails. For example (these aren’t real data, but just a sample – your results may vary, and that’s totally fine!):
- Short, clear emails get more clicks.
- Personalized subject lines lead to higher open rates.
- Emails sent in the morning receive more attention.

- Make Changes and Test Them Now that you’ve gathered insights, start making small adjustments like:
- Revamping your subject lines to make them more engaging and increase open rates.
- Testing different content formats: visual vs. text-based.
- Adjusting send times to match when your audience is most responsive.
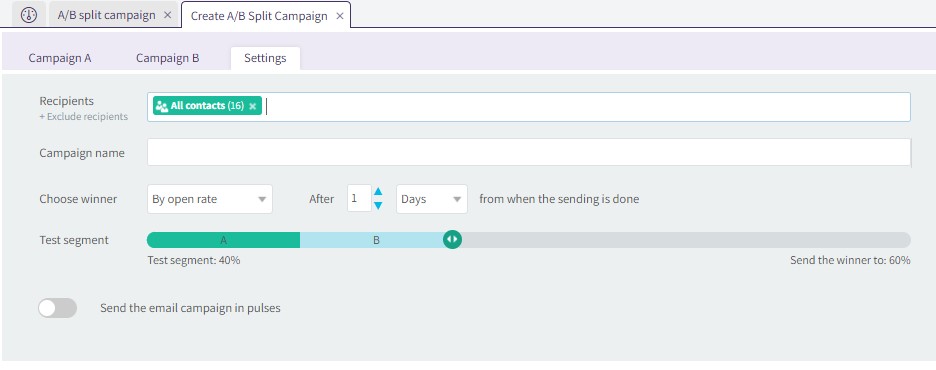
- Improve with A/B Testing Run A/B tests to find what works best for you. For example:
- Compare two different subject lines for the same email.
- Test different button colors for the “Read More” link.
- Try creating different versions of your email layout.
The system has a separate A/B testing module (under “Campaigns & Messages”), and it’s super easy to use, so it’s definitely worth trying out!

Using smoove for Email Analytics
smoove gives you everything you need to analyze your email performance:
- Detailed Performance Reports – Track opens, clicks, and unsubscribes.
- Segmentation and Personalization Tools – Send personalized emails to different audiences.
- Interactive Click Breakdown – See exactly which links in your emails got the most clicks.

In Short, Data is Power
When you learn to analyze email data smartly, you turn information into a strategic tool for continuous improvement. So, dive into your reports, understand the numbers, and start pushing your business forward. Every action you take today will pay off tomorrow. Feel free to share your insights in the comments below!

